Visual Answer for Voice Assistant
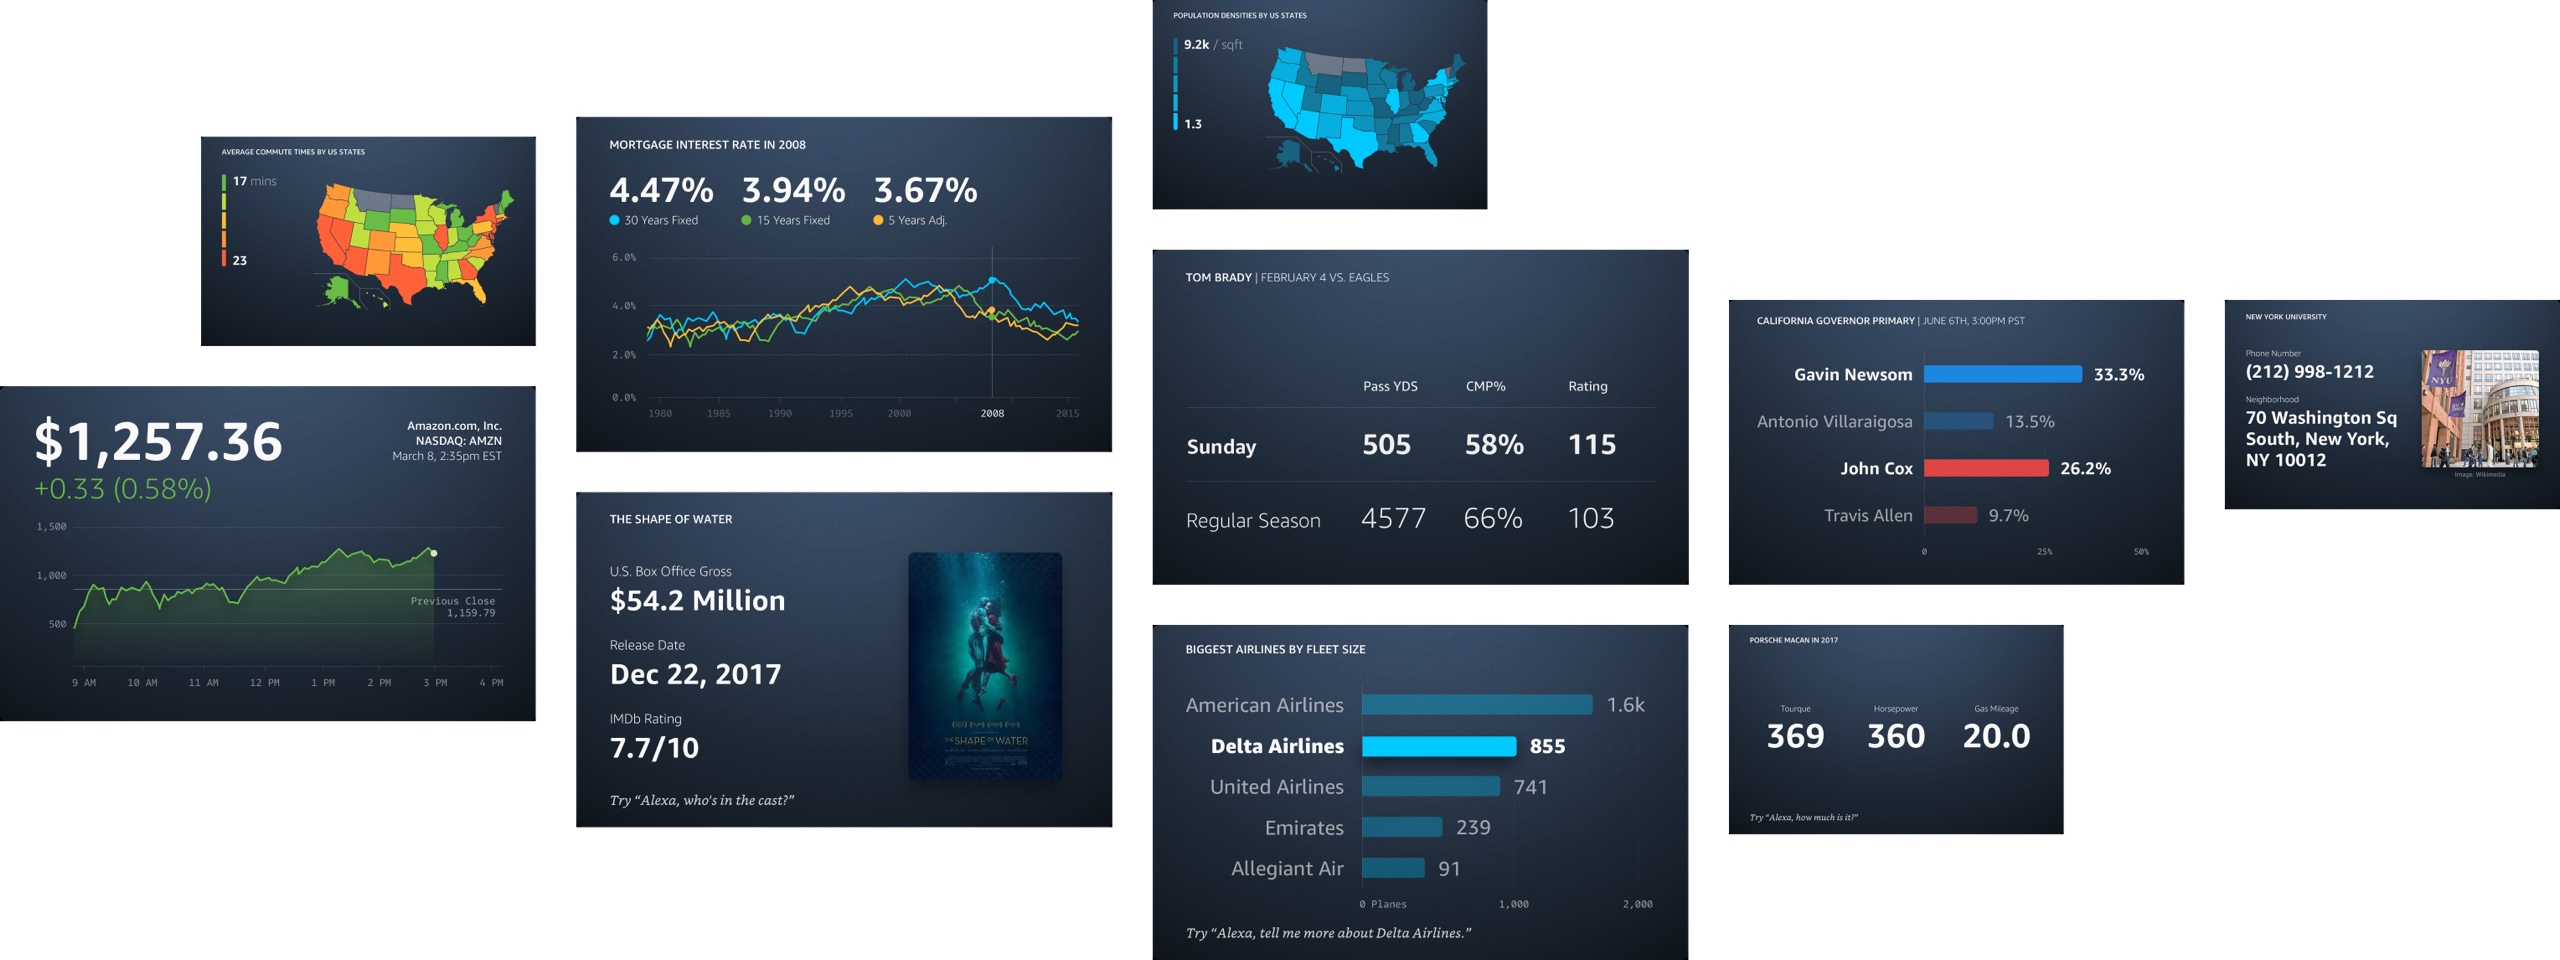 |
When Graphiq got acquired by Amazon in May 2017 to help Alexa answer more factual questions, it was right before Amazon launched its first Alexa device with a screen — the original Echo Show device. In addition to the knowledge graph and search technology, the Alexa team was excited about our visualization capability as well. I had a clear task — bring data visualizations to Alexa and deliver information in the most delightful way for our customers.
Sharing the Vision
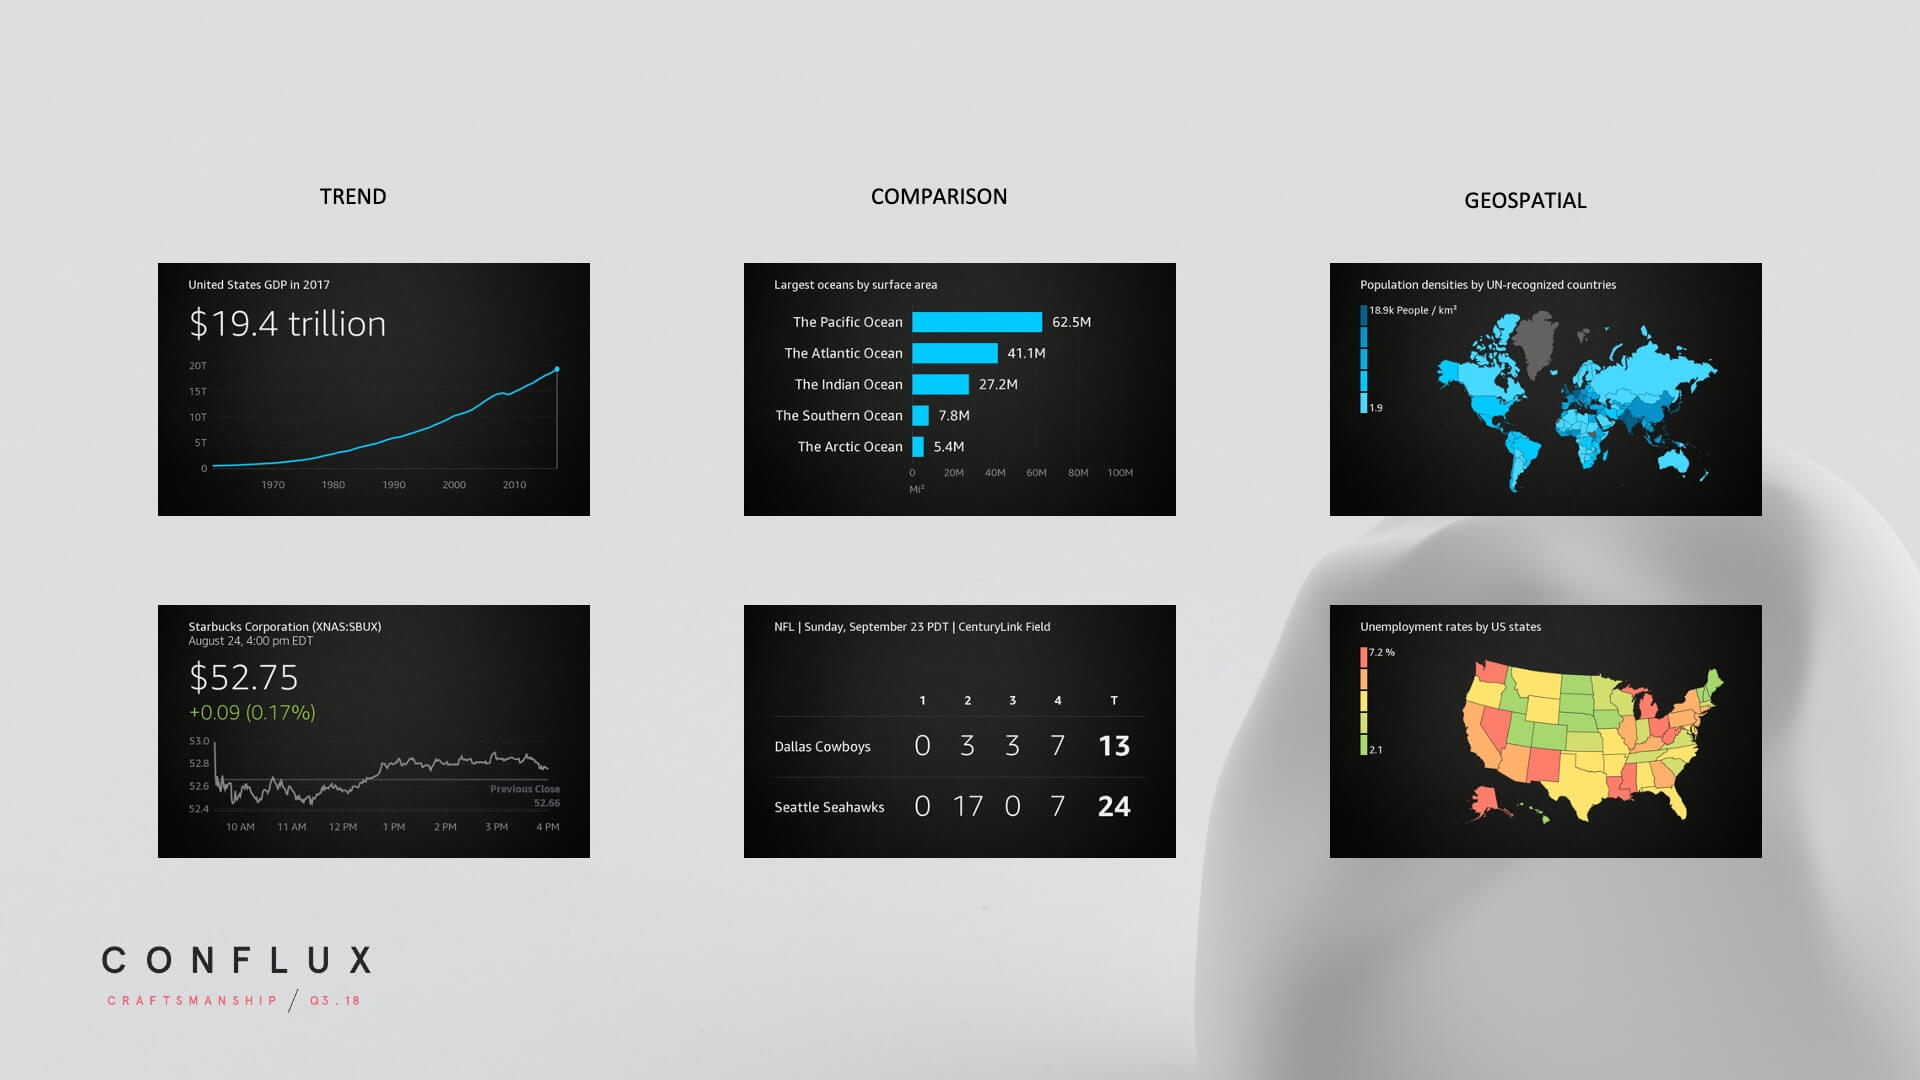
Alexa was introduced as a voice assistant, and many had not envisioned it having screens back then. That said, visual display is not only delightful but crucial to communicate trend, comparison, and geographic data.
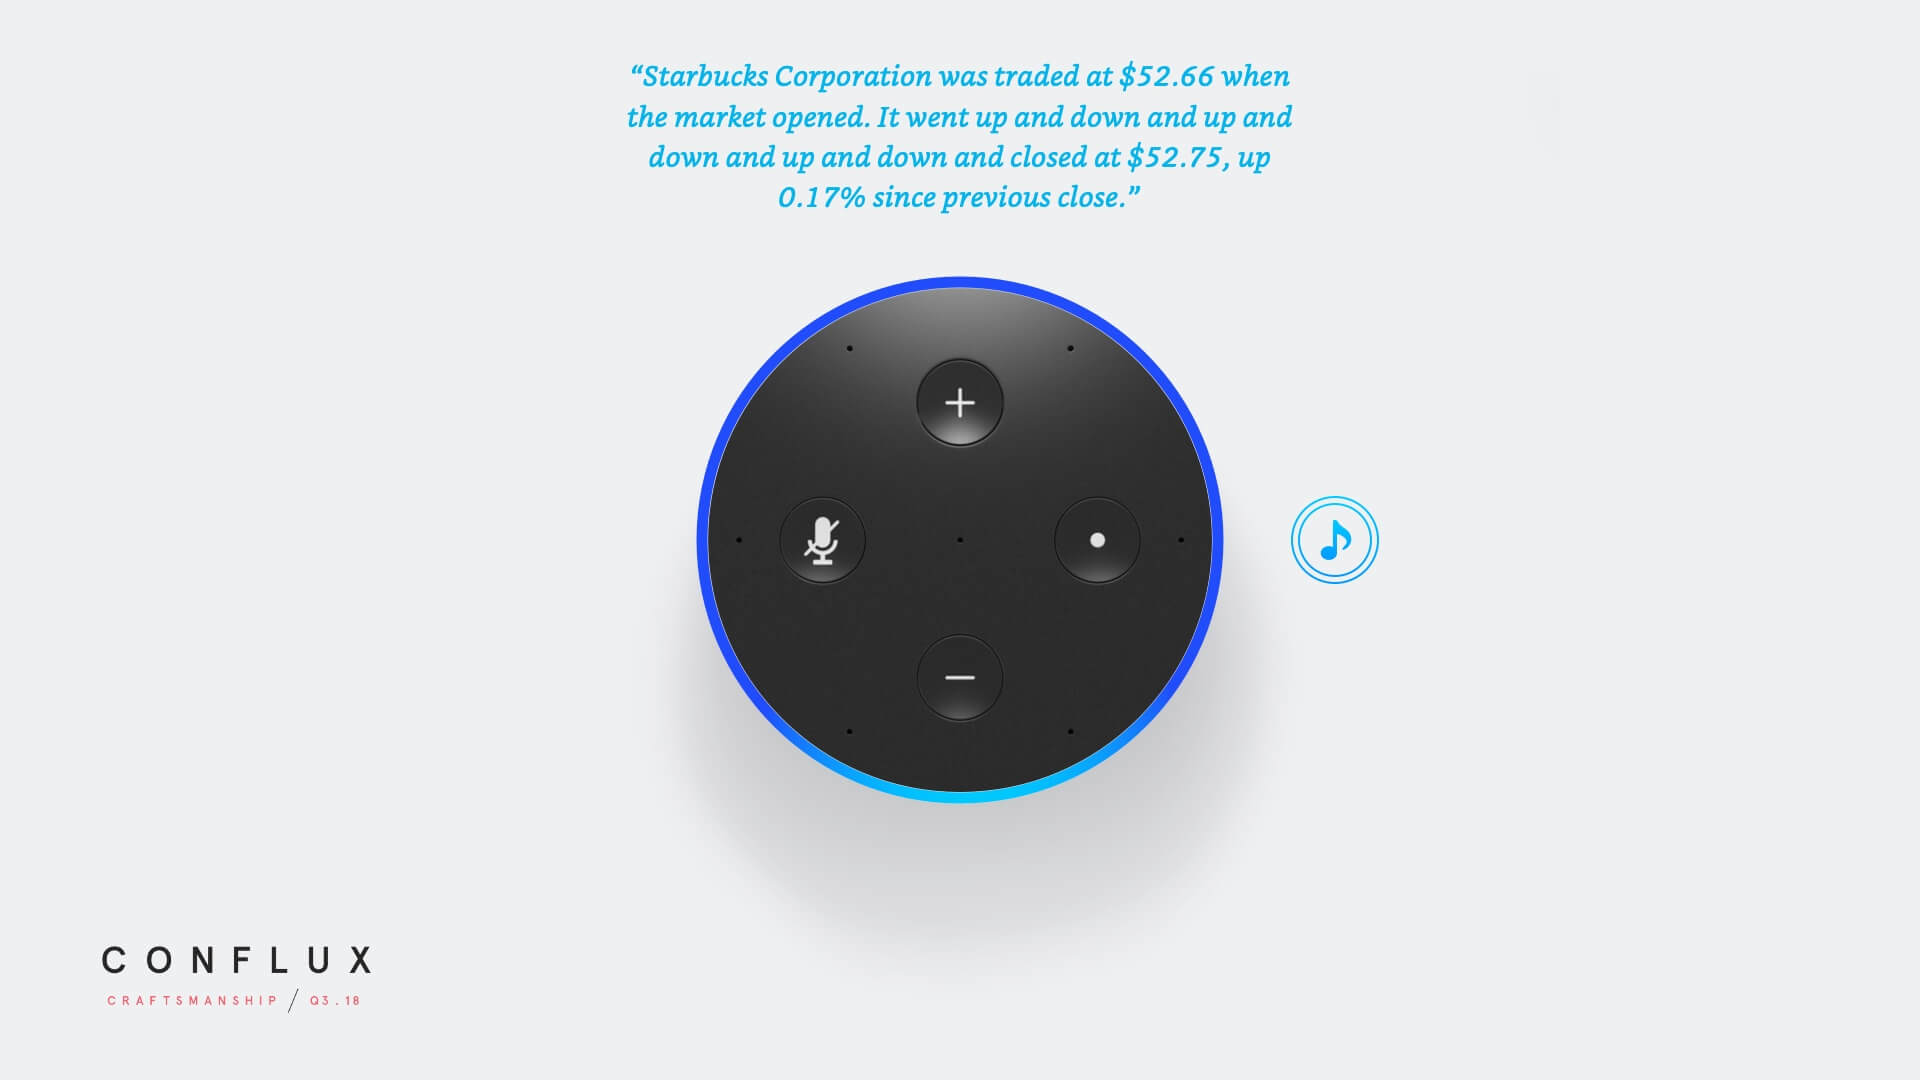
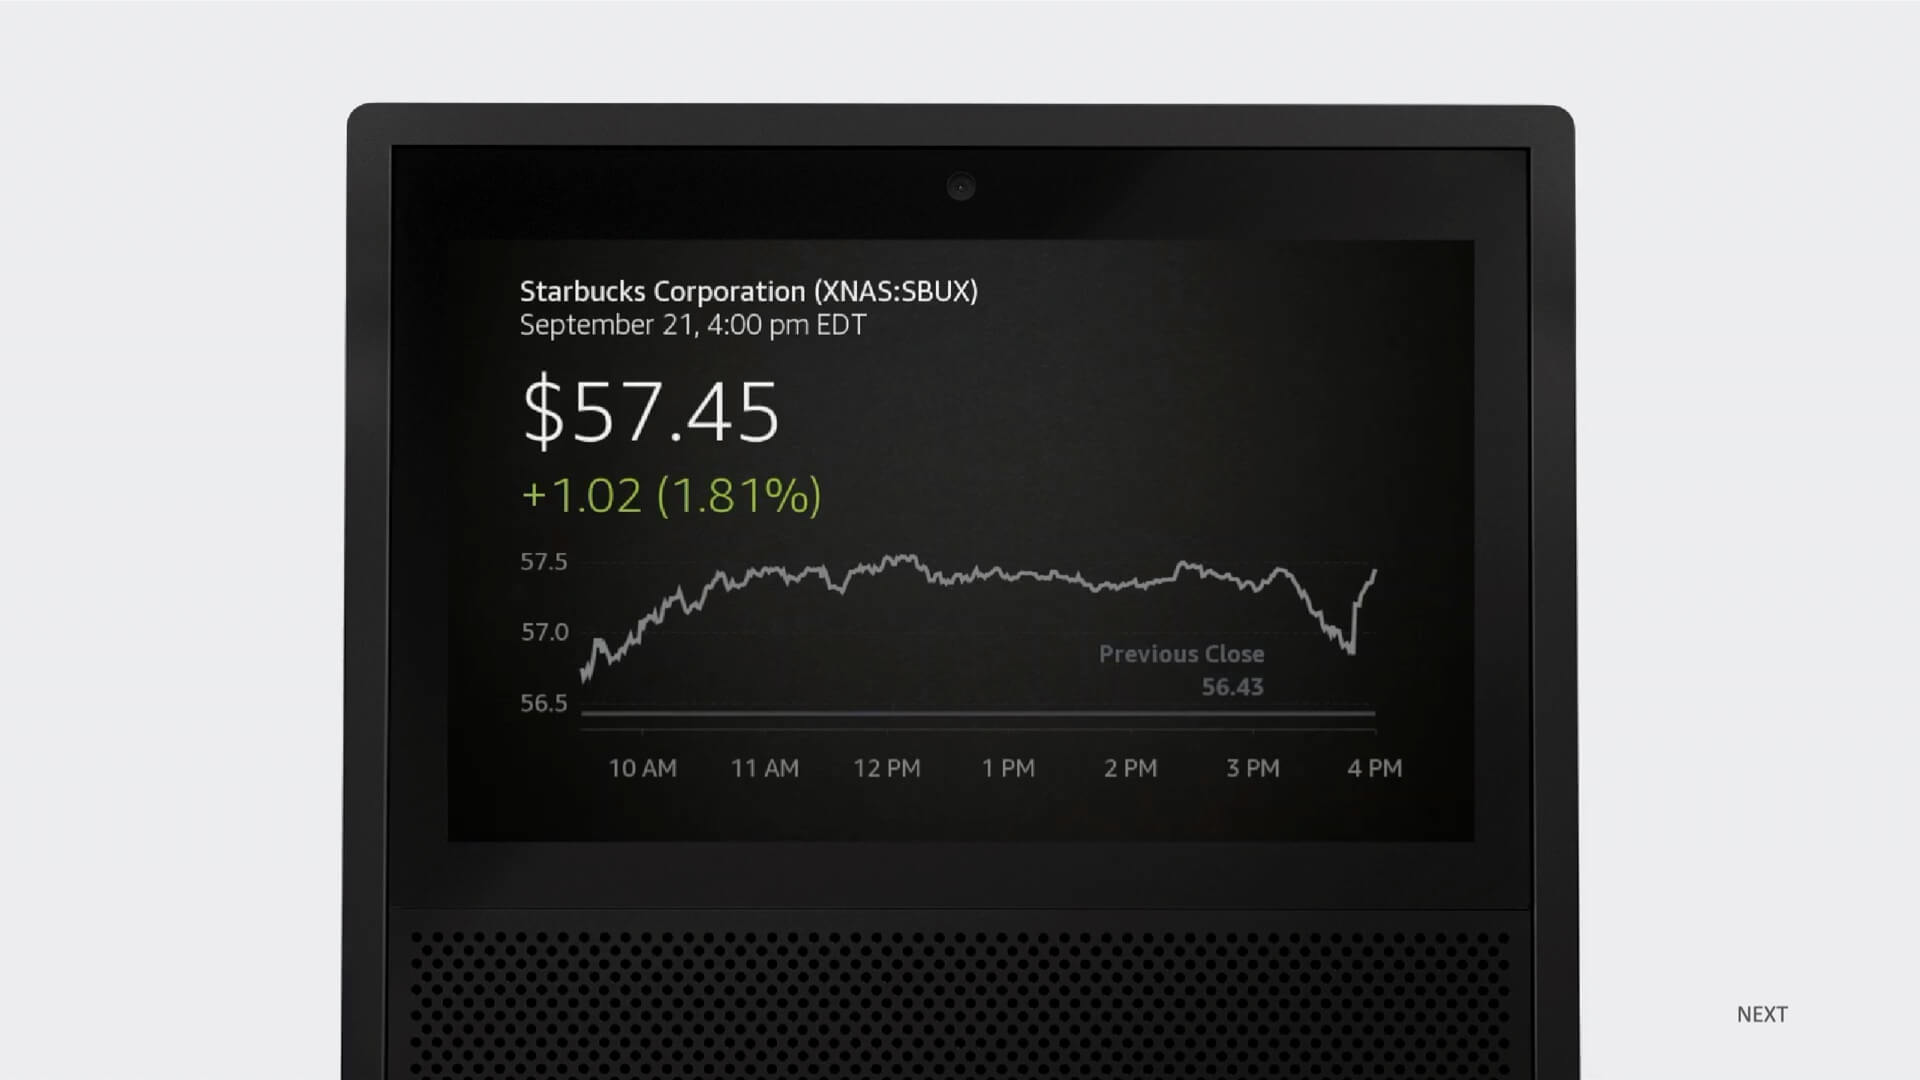
For exmaple, for the question “Alexa, What’s the stock price of Starbucks?” it is difficult to convey the fluctuation in the market with voice, but with visual, the trend is clear.
 |
 |
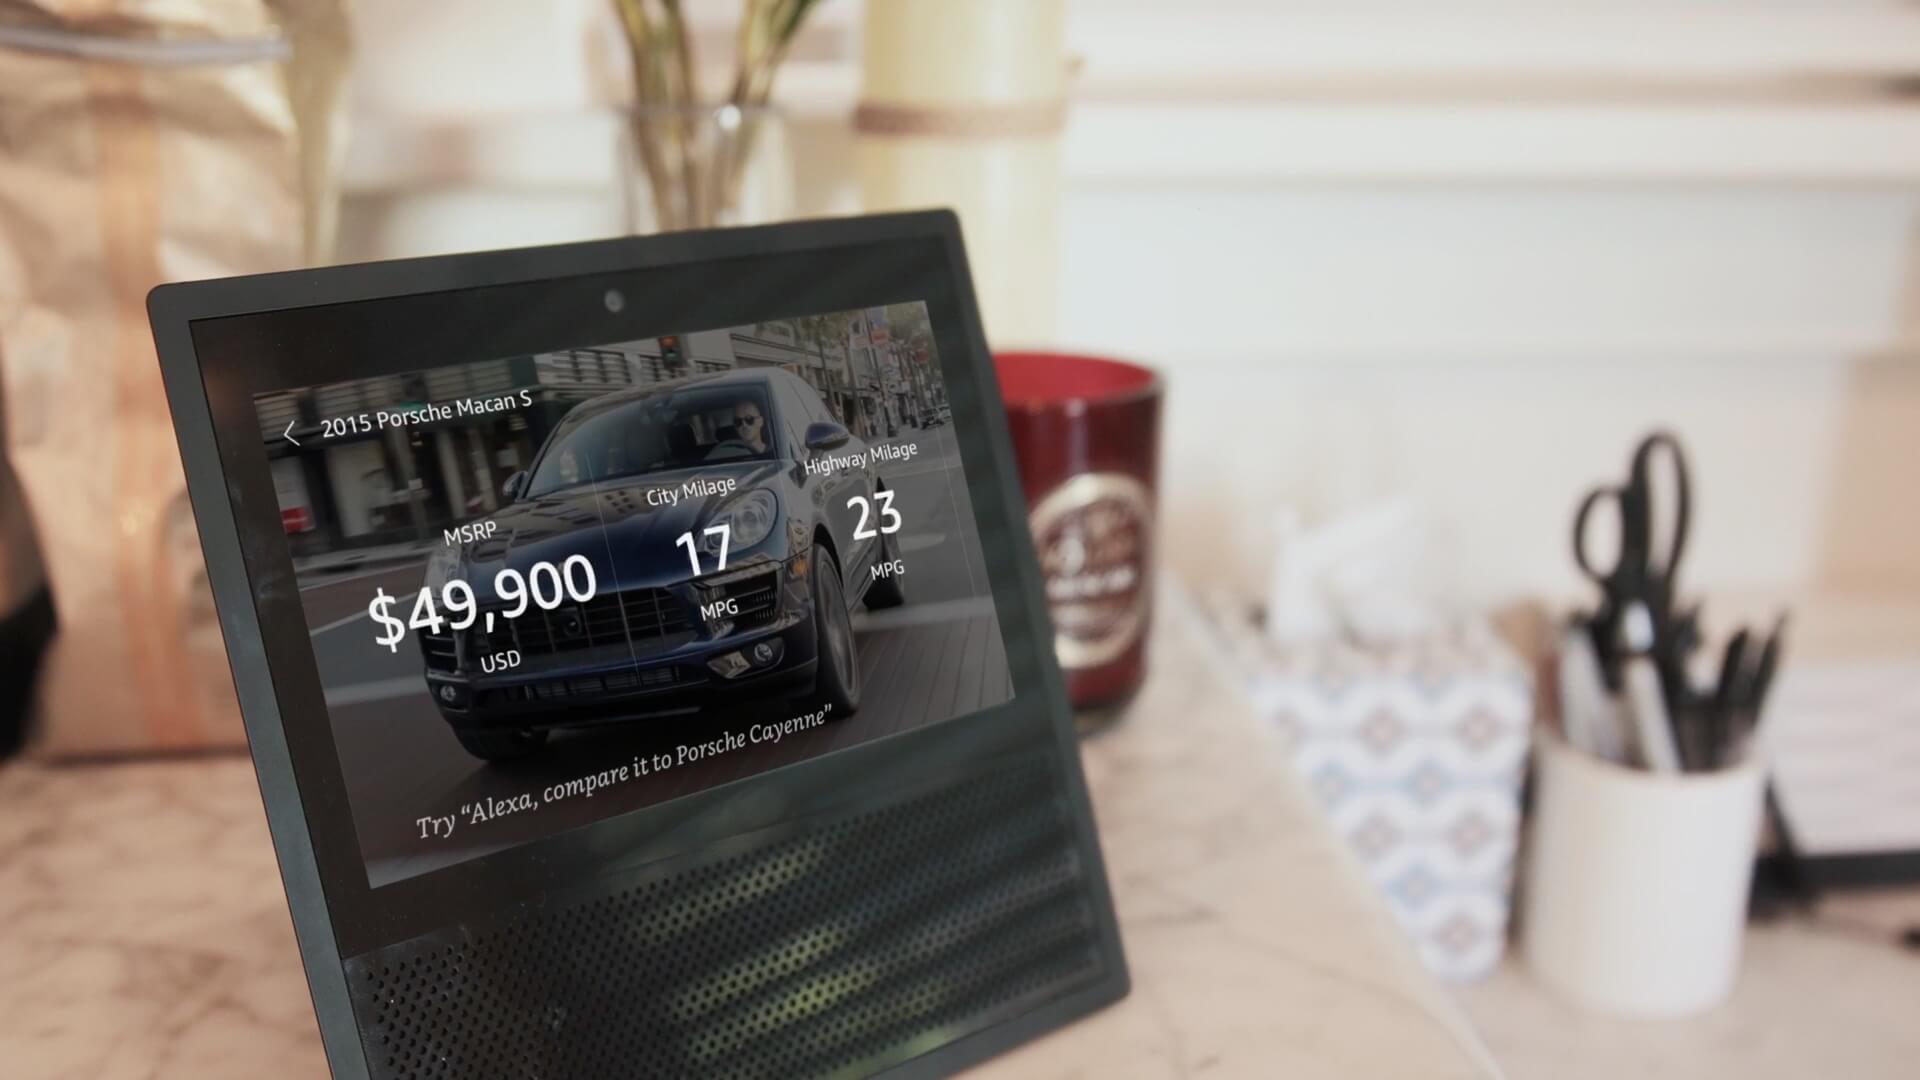
To help the team understand the potential of visualization and imagine the future together, we put together a commercial-like demo video to show how we can drastically improve many Alexa experiences — from help making purchase decisions to getting sports and stock market updates. It got shared to the top of the leadership in the company, and many of the future we envisioned, has become a reality today.
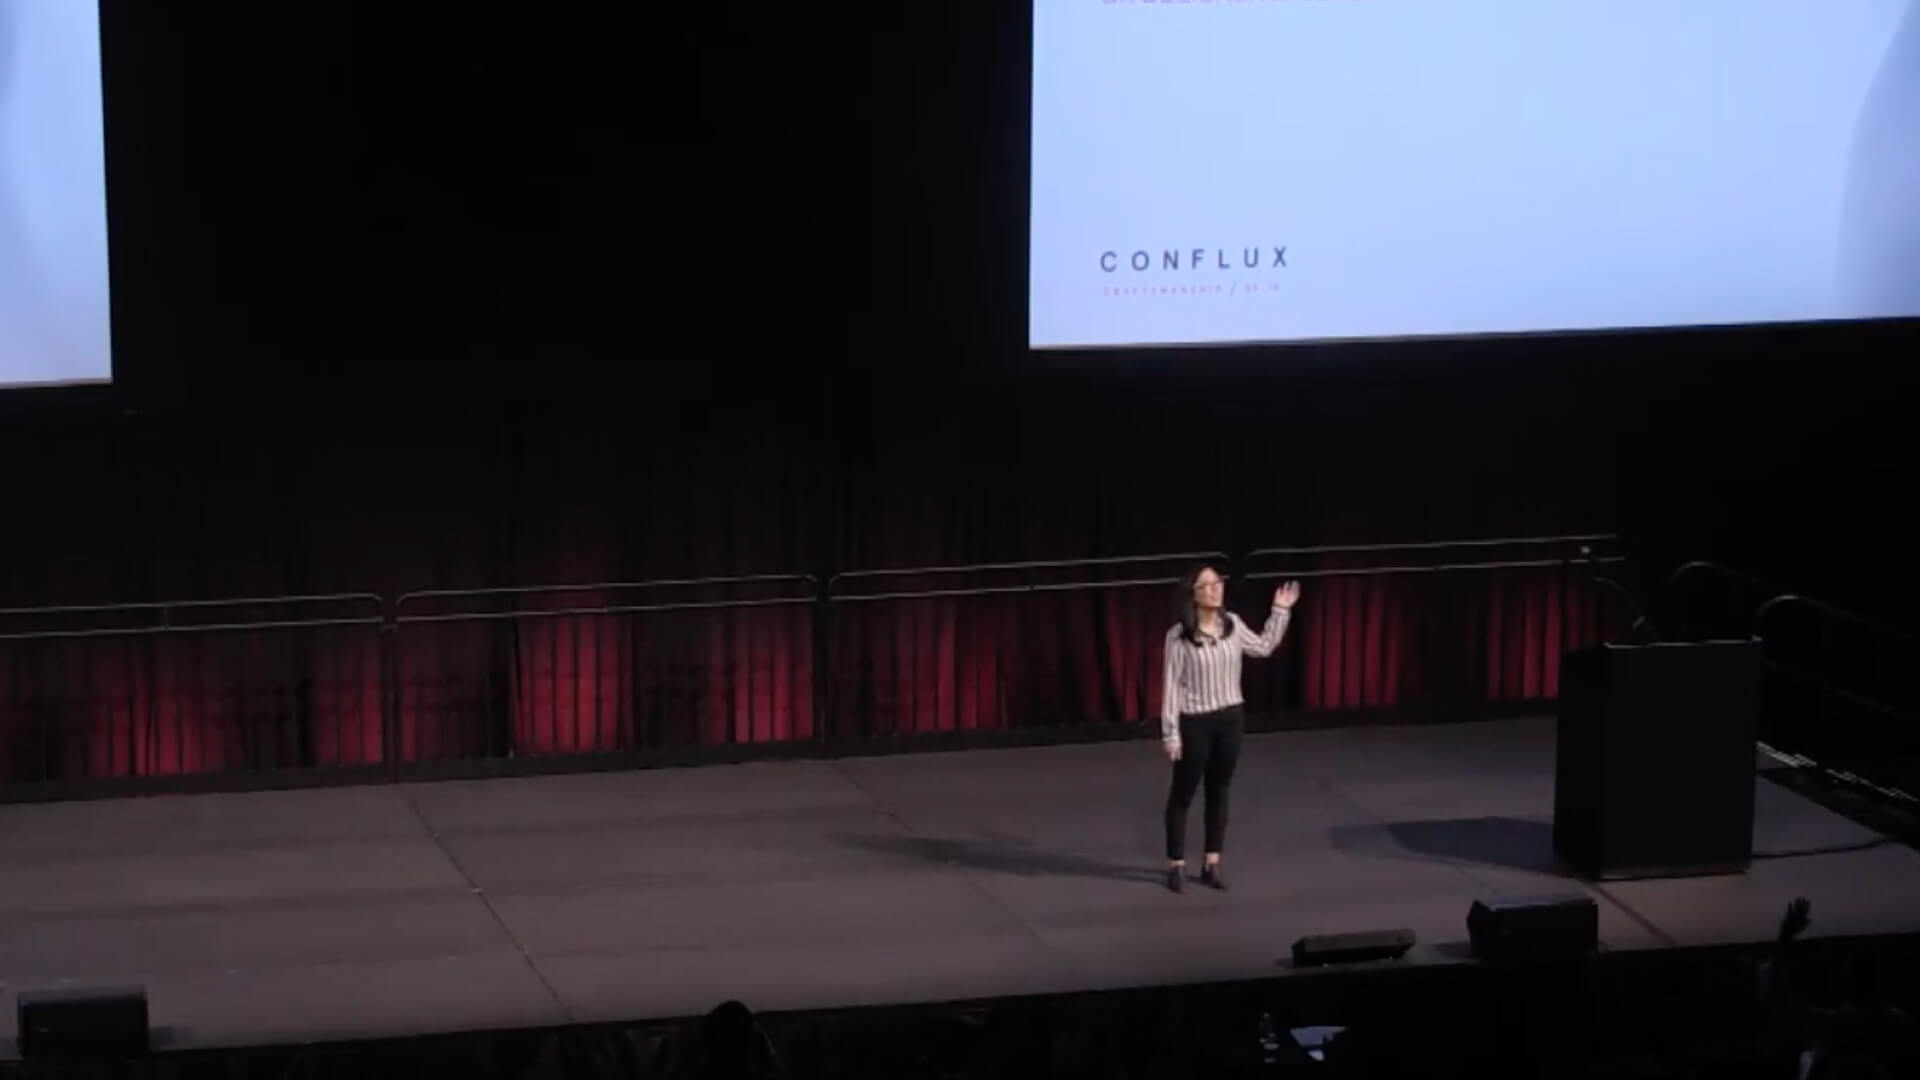
Further, I did a presentation at Amazon’s annual design conference to walk through the key cases for visual answers, the design challenges, and our solutions.
 |
 |
 |
Crafting and Co-defining Alexa Design System
We joined at an exciting time when the first barebone version of Alexa’s visual style just got shipped and the team is actively imagining what the second generation can look like.
We brainstormed with the central design team at Alexa to co-define a new design language that can afford all the data presentation need we can foresee.
 |
After multiple rounds for exploration and consolidation, we landed on what became the next generation of Alexa Design System, and laid out the ground work for the core visual answer template, including animations and touch interactions.
Continuous Development
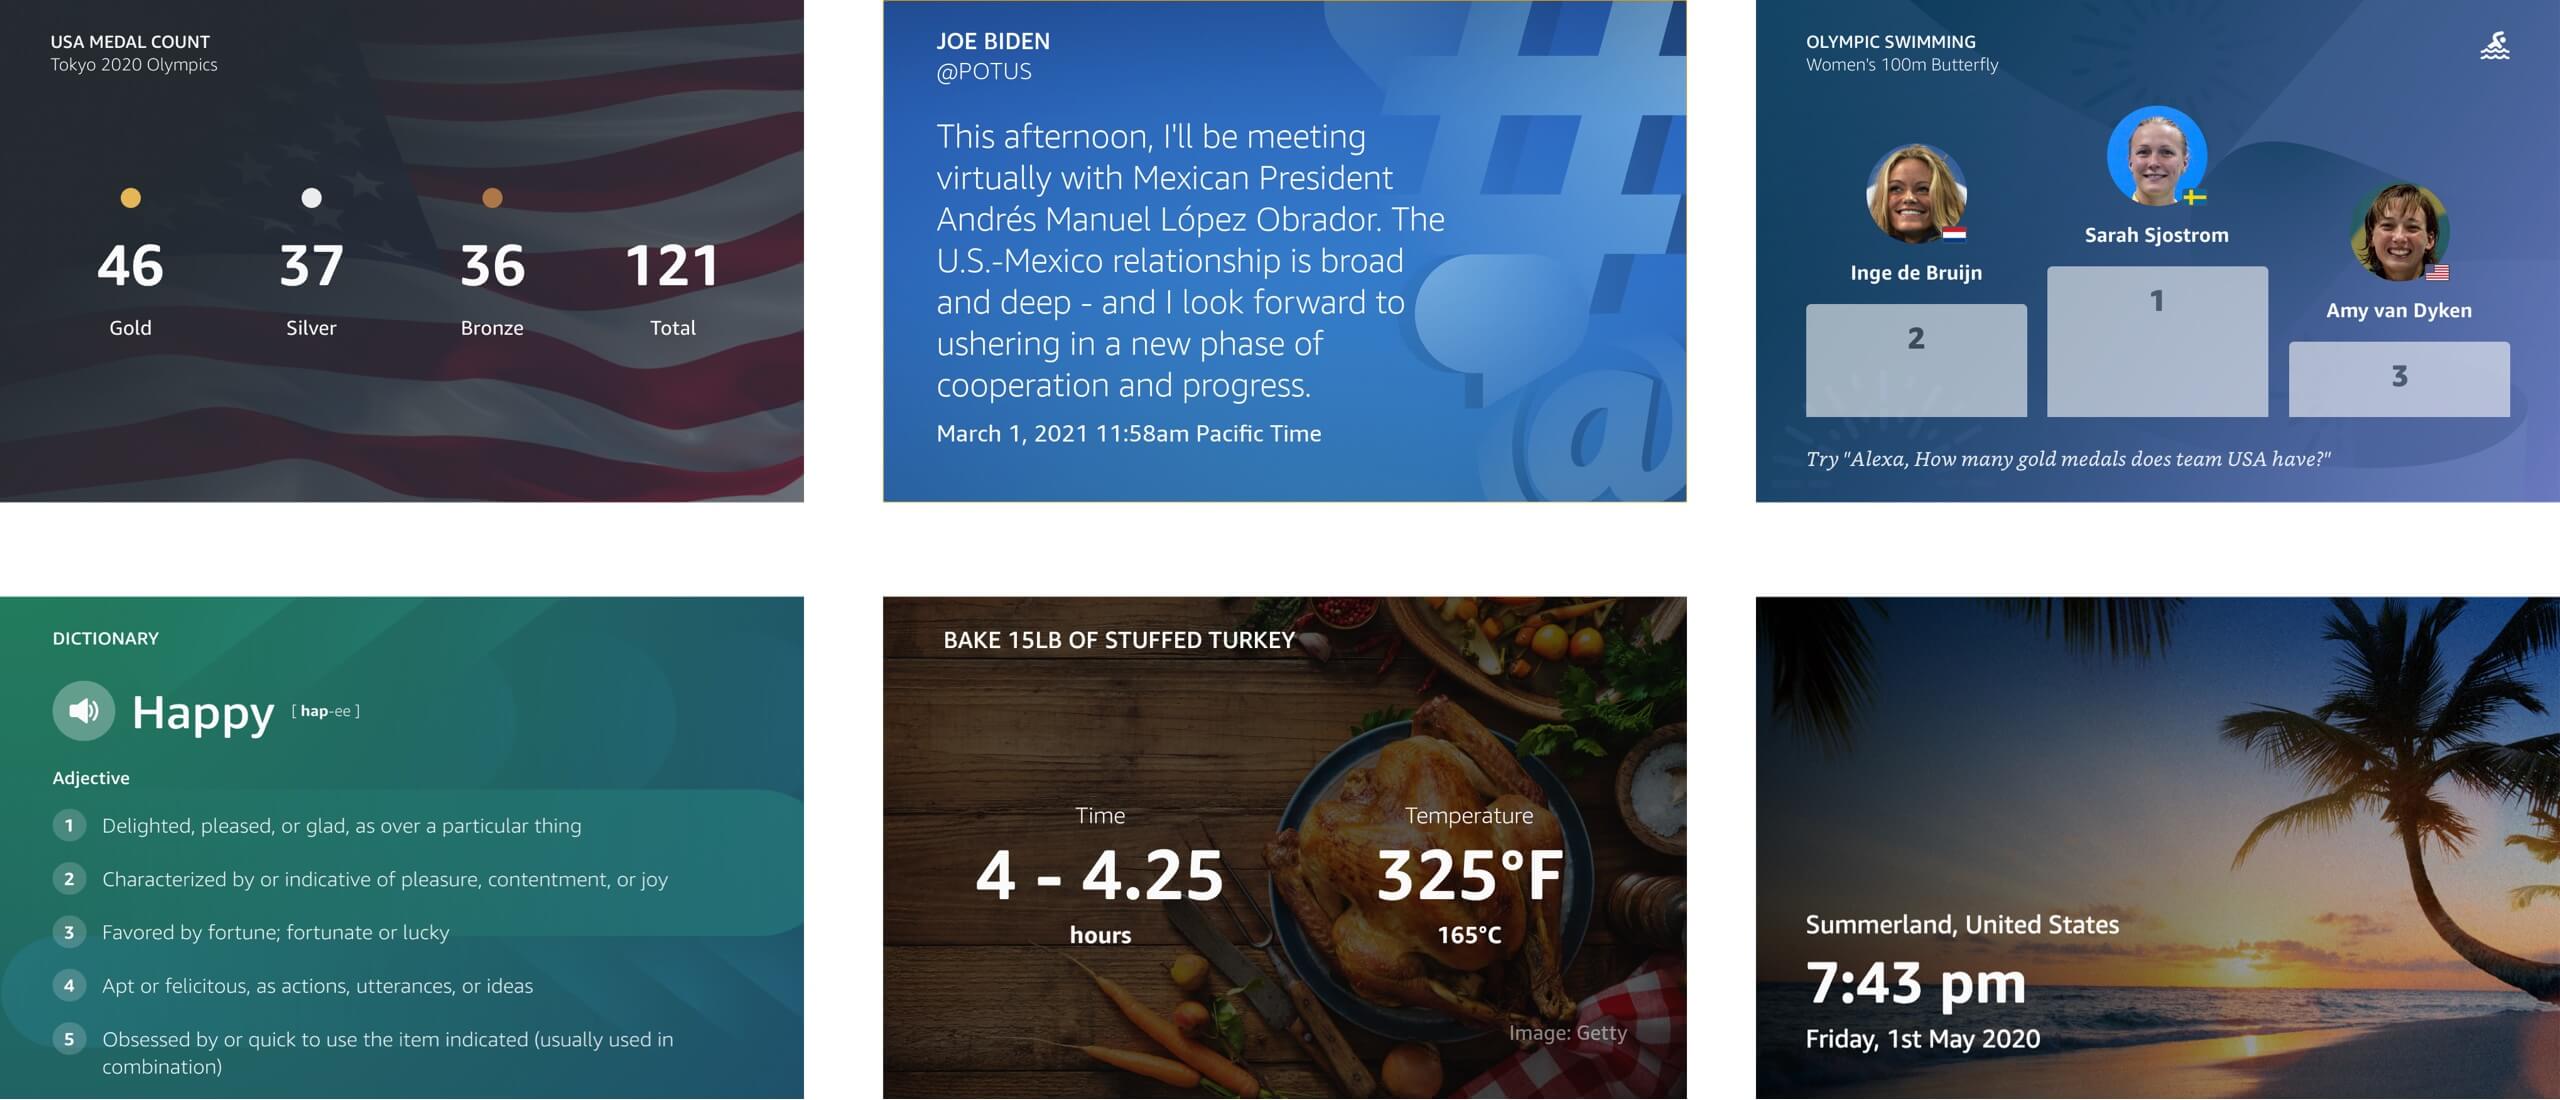
We kept developing and improving the multimodal experiences over the years in visual style, range of visualizations offered, and the design of each template by listening into the customers. Here are some notable addition we made afterwards.
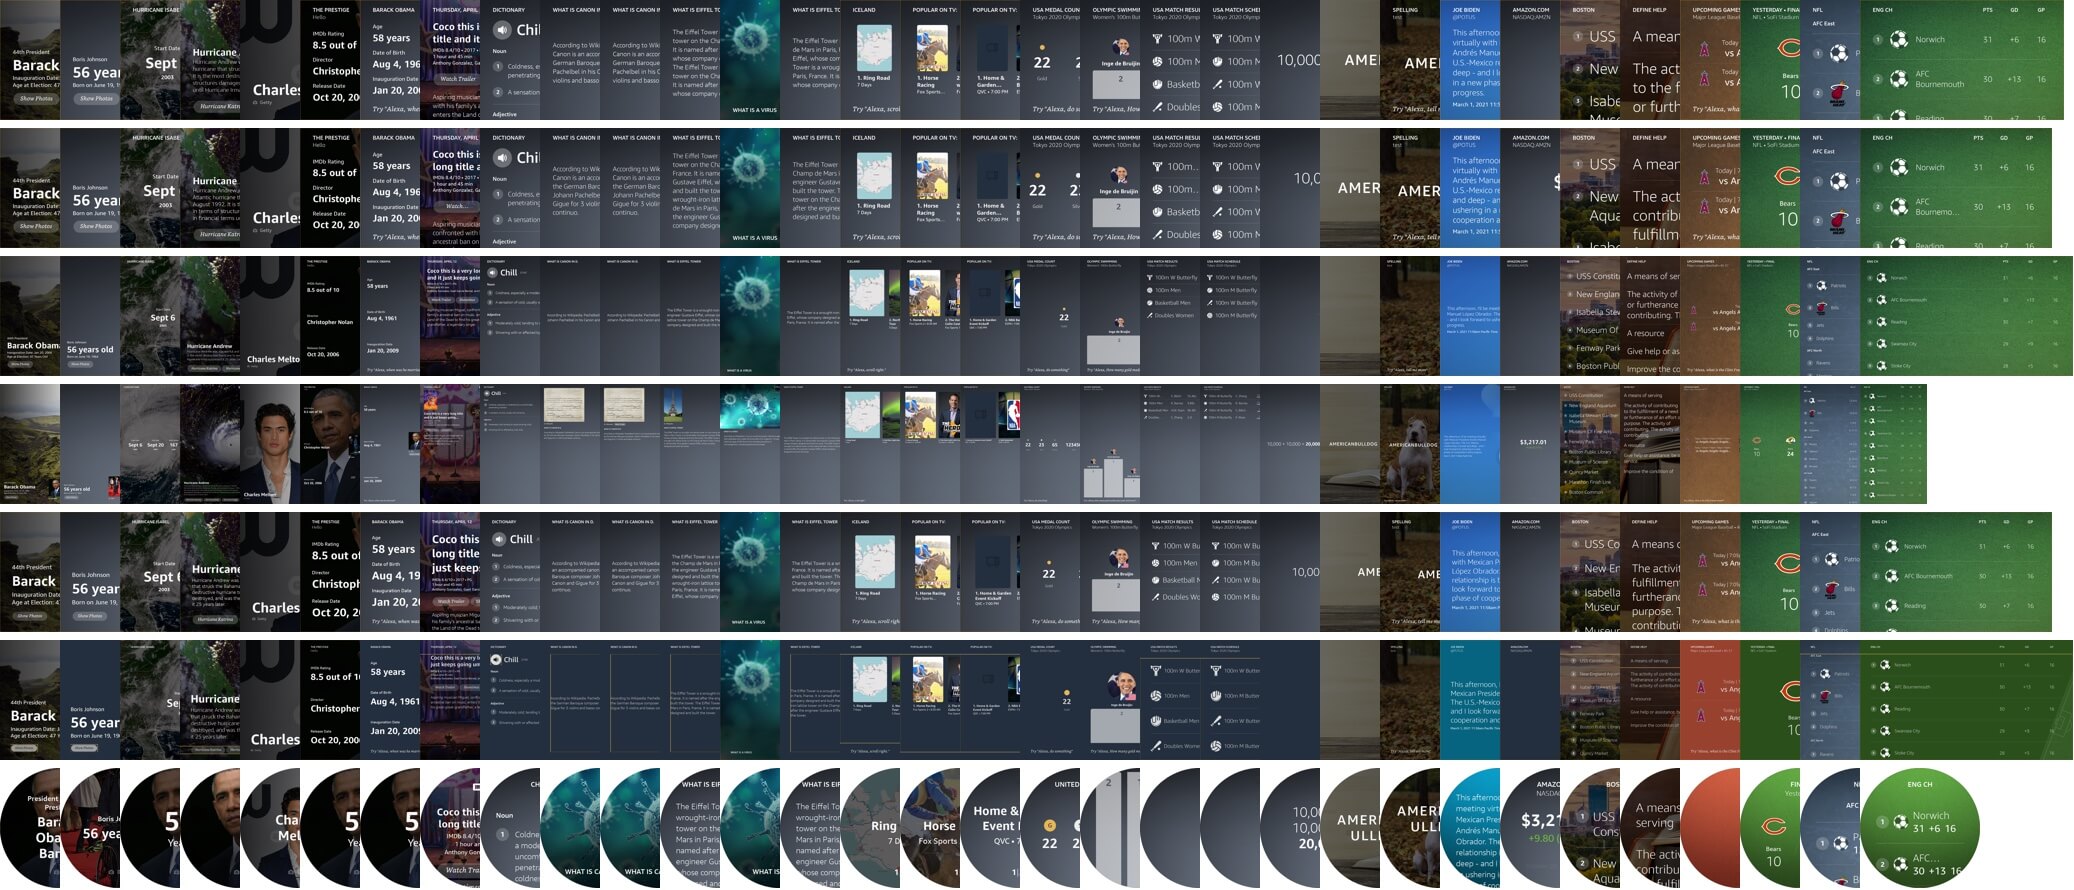
Lastly, a bird’s eye view of the landscape of use cases we now cover — templates x devices.
I hope you find this article useful. If you want to get an email every time I write something new, subscribe to the list below.