Crafting Design Systems for Big Data
First posted at design.blog
Tailoring design for one dataset is easy — designing a system that works for all datasets is much more difficult. As we enter this era of big data, we face a critical challenge: how do we create more robust, scalable designs that can adapt to different content inputs and edge cases?
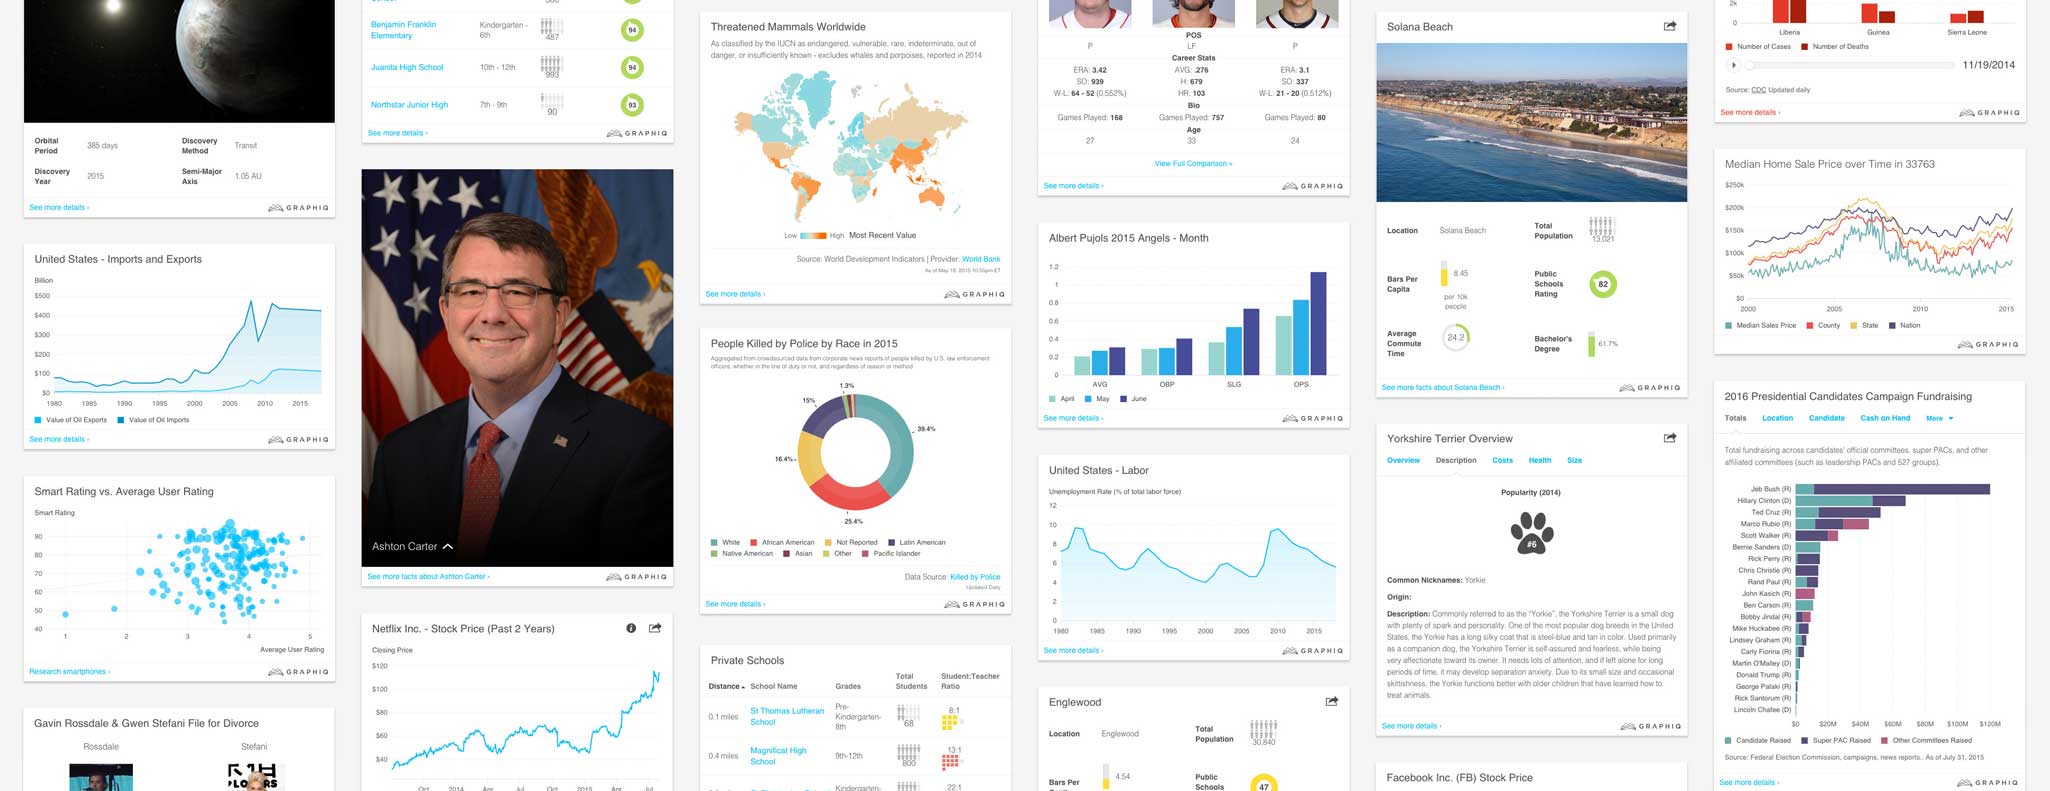
That’s exactly the kind of system that we’ve been building at Graphiq — a system that powers more than 10 billion embeddable visualizations on 700 topics, generating more than 300 million impressions per month on the websites of some of the world’s largest publishers.
Here are a few things we learned in the past three years creating and perfecting our system:
A. Understand the Data Span and Use Cases
When thinking about design systems, it’s natural to start by thinking about the UI kits, pattern libraries, and brand guidelines that we see all the time. Similarly, it’s very easy to jump into designing for each element — color palette, bar chart, button, and more. There are even tutorials and templates designed specifically for this purpose.
If you are designing a resources package without any defined use case, that’s surely the way to go. But if you’re creating a design system with a given purpose, it’s good to understand the scope of data and use cases to better focus your resources.
At Graphiq, we need a design system that is able to host all content and chart types, but realistically, 70% of our visualizations are bar charts, line charts, or area charts. It makes sense for us to focus our energy on those more prevalent chart types, rather than evenly distribute our efforts across all chart types.
Similarly, we want to be able to display all attribute labels, no matter how long or short they are, but knowing that most of those labels are between 15 and 30 characters definitely helps.
In general, the popularity of all use cases in a design system would fall on a curve like this:
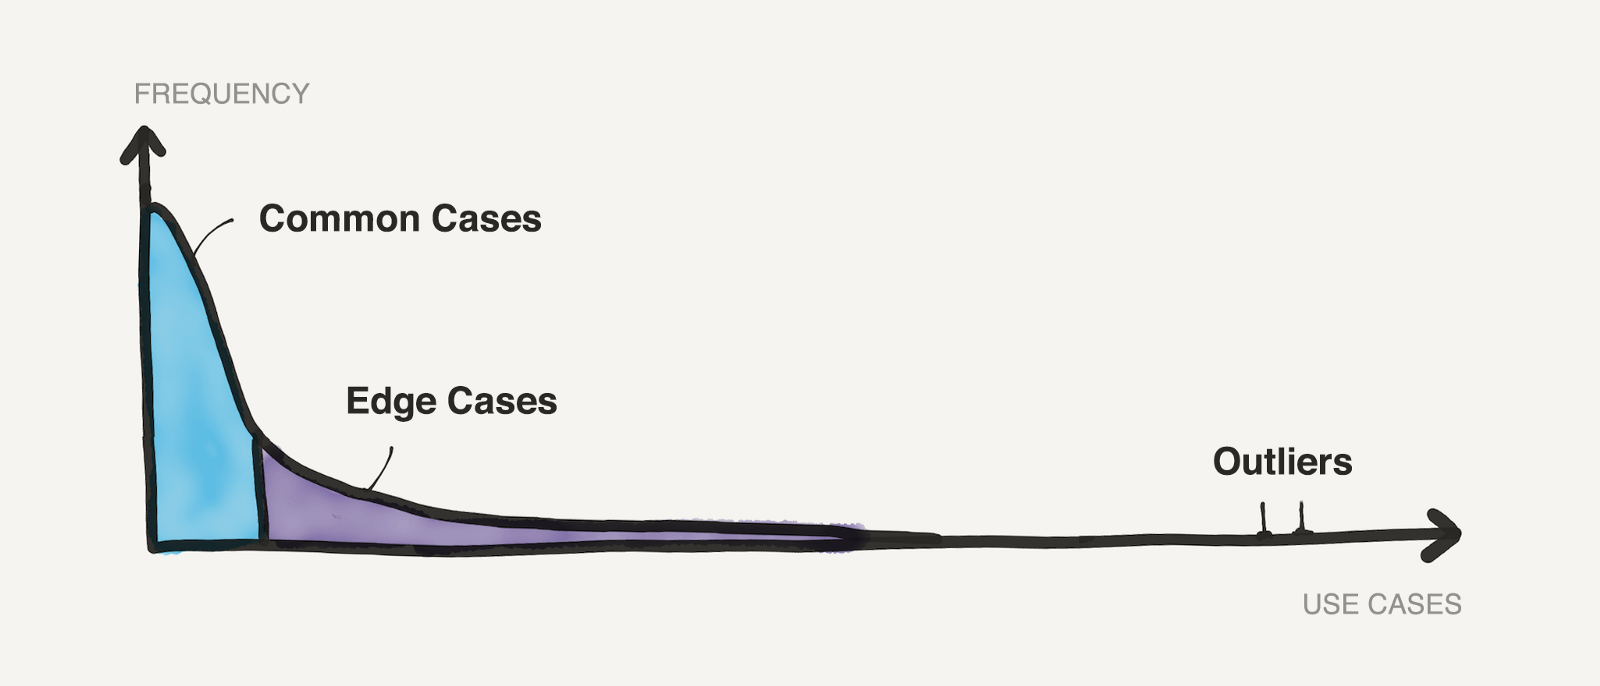
Once you have an idea of the distribution, then it’s easy to focus your resources to design for common use cases, take care of edge cases, and then deal with the outliers.
B. Design for Common Cases
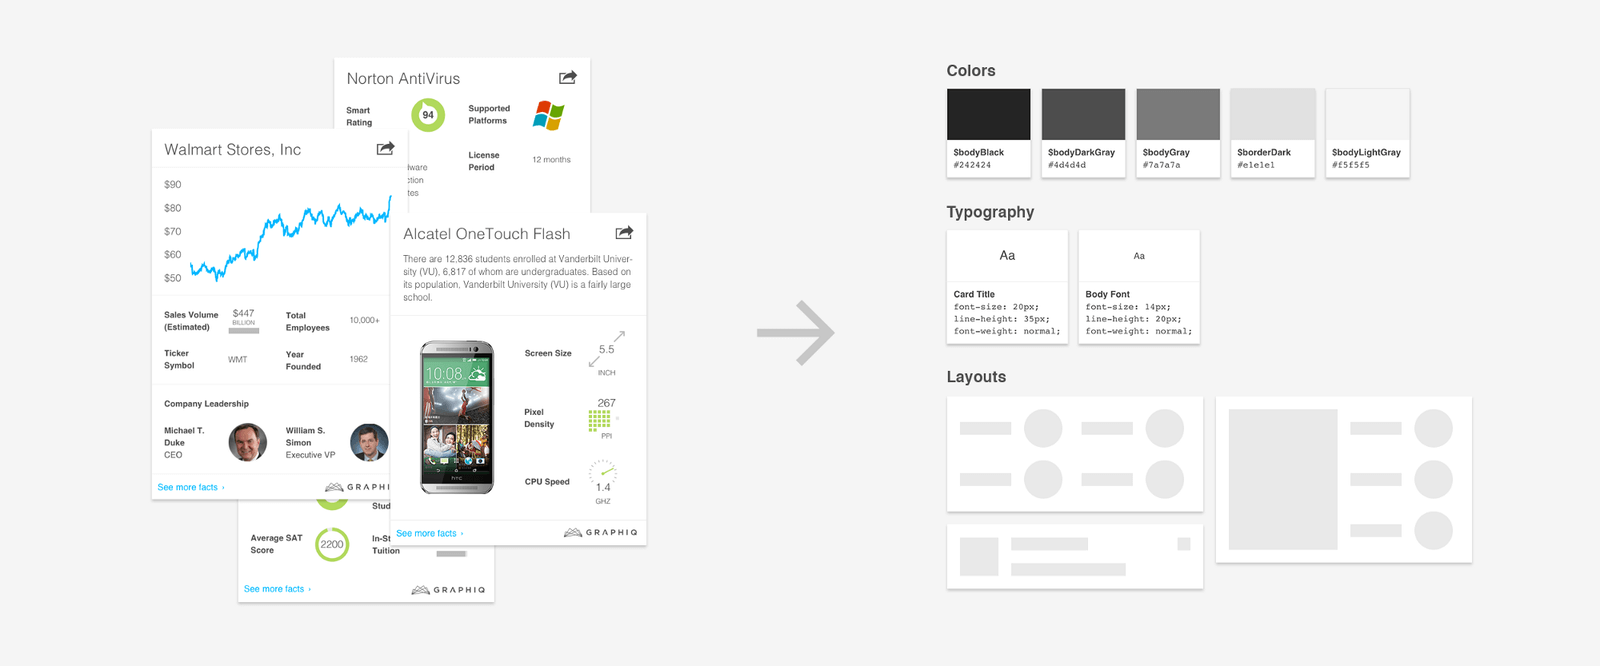
Designing for common cases should be relatively easy — you could even treat them as Dribbble shots — just make the best possible version of each use case. We found it more useful to start with those ideal designs than to start with common elements because the system should serve the users, not the other way around.
Once we have a good collection of design for those popular use cases, we then organize them to become the core of our design system.
 |
C. Take Care of Edge Cases
After crafting the system around common cases, we can move on to the edge cases. A few typical edge cases we encounter over and over again are:
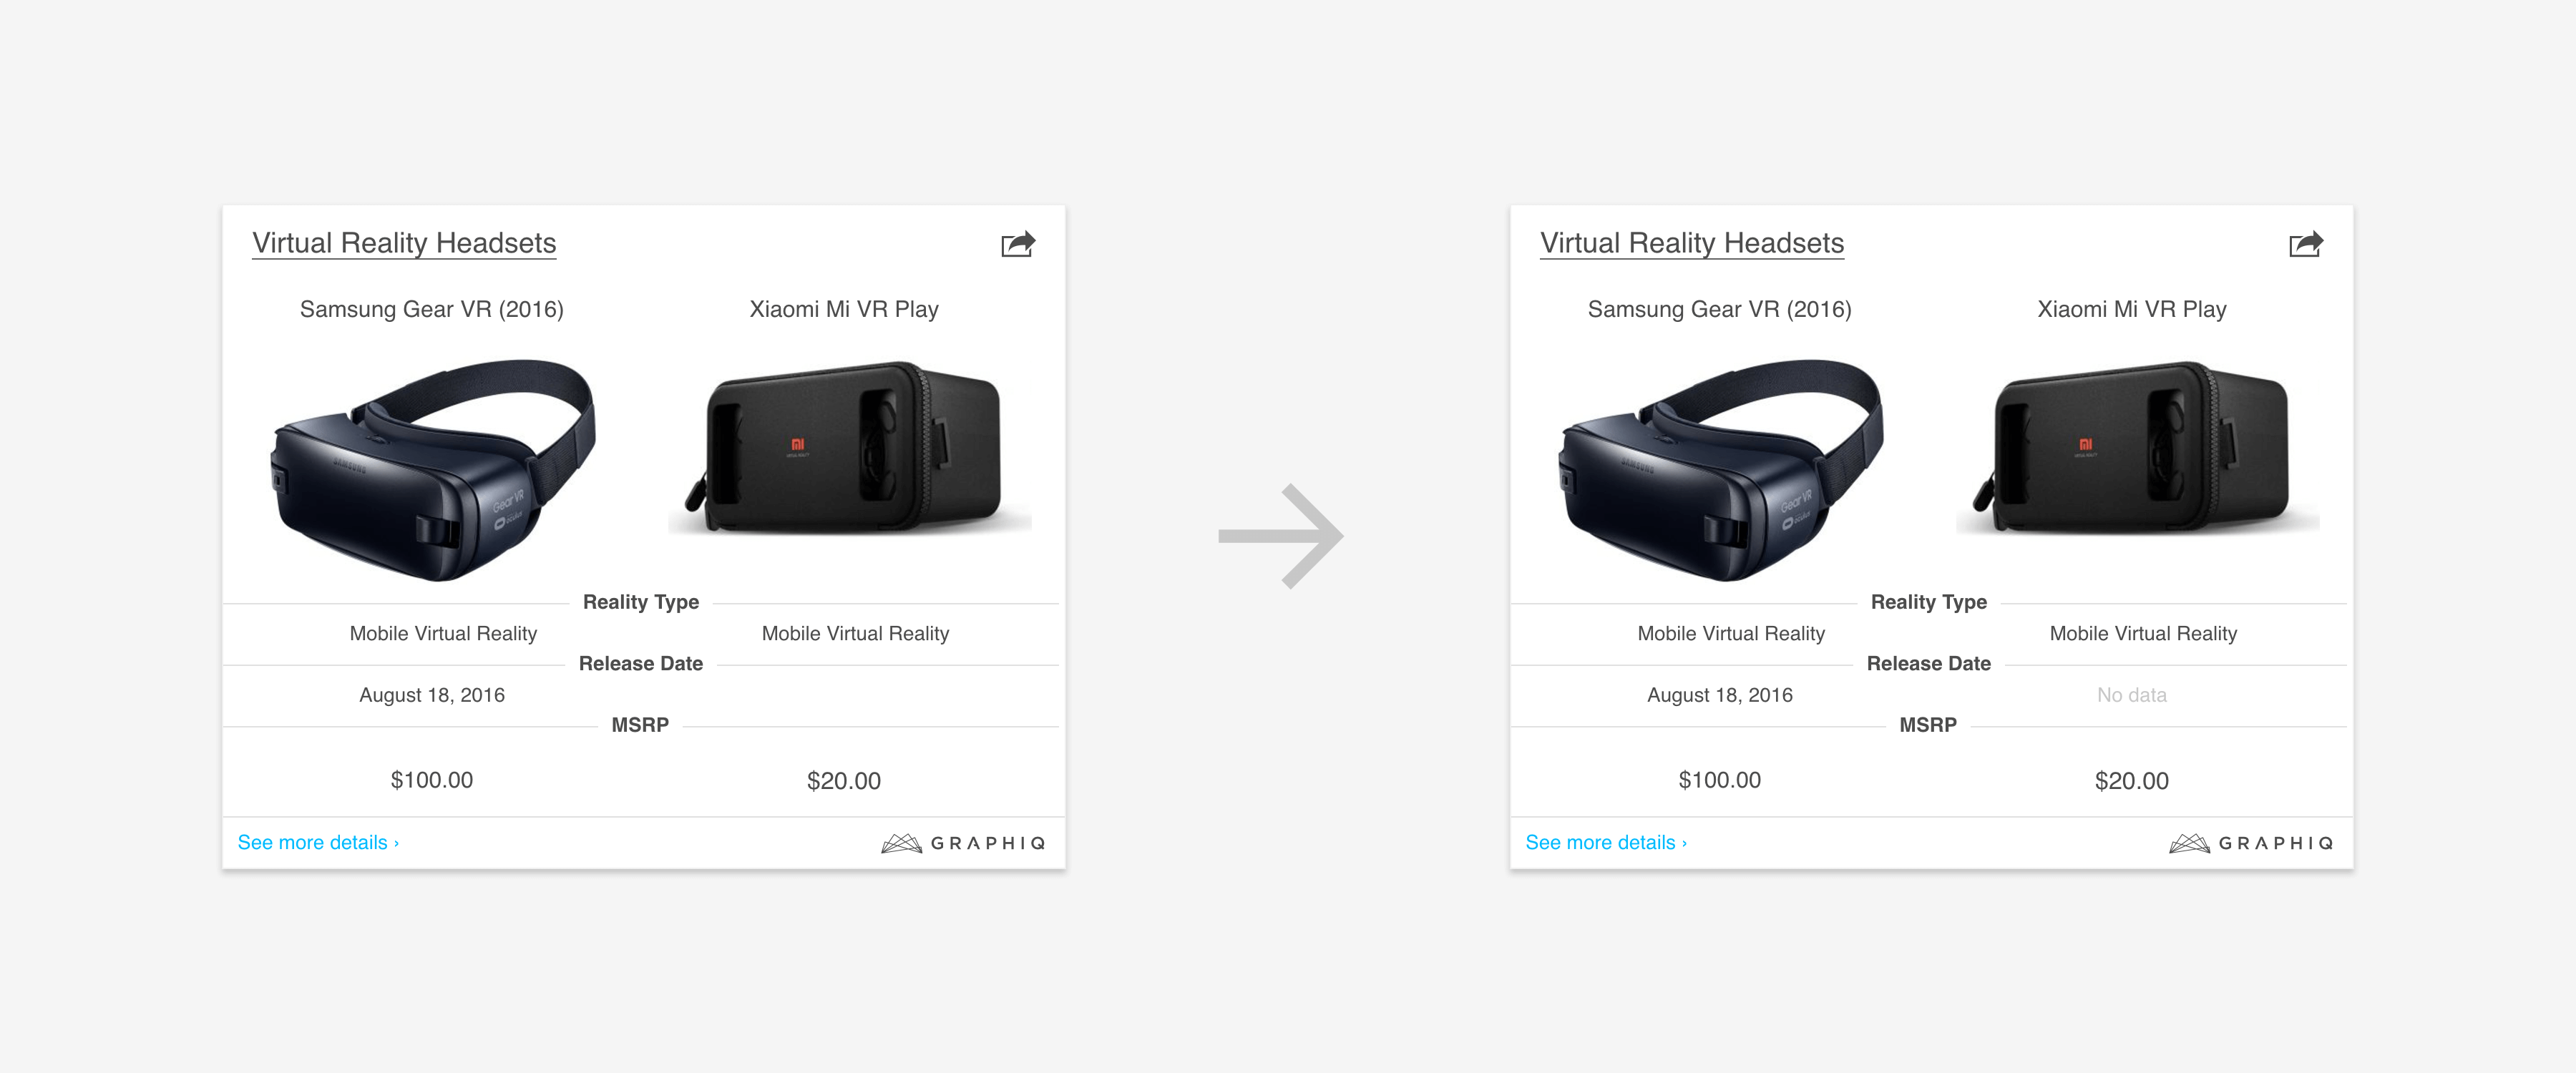
1. Missing Data: Communicate the issue instead of showing a blank space.
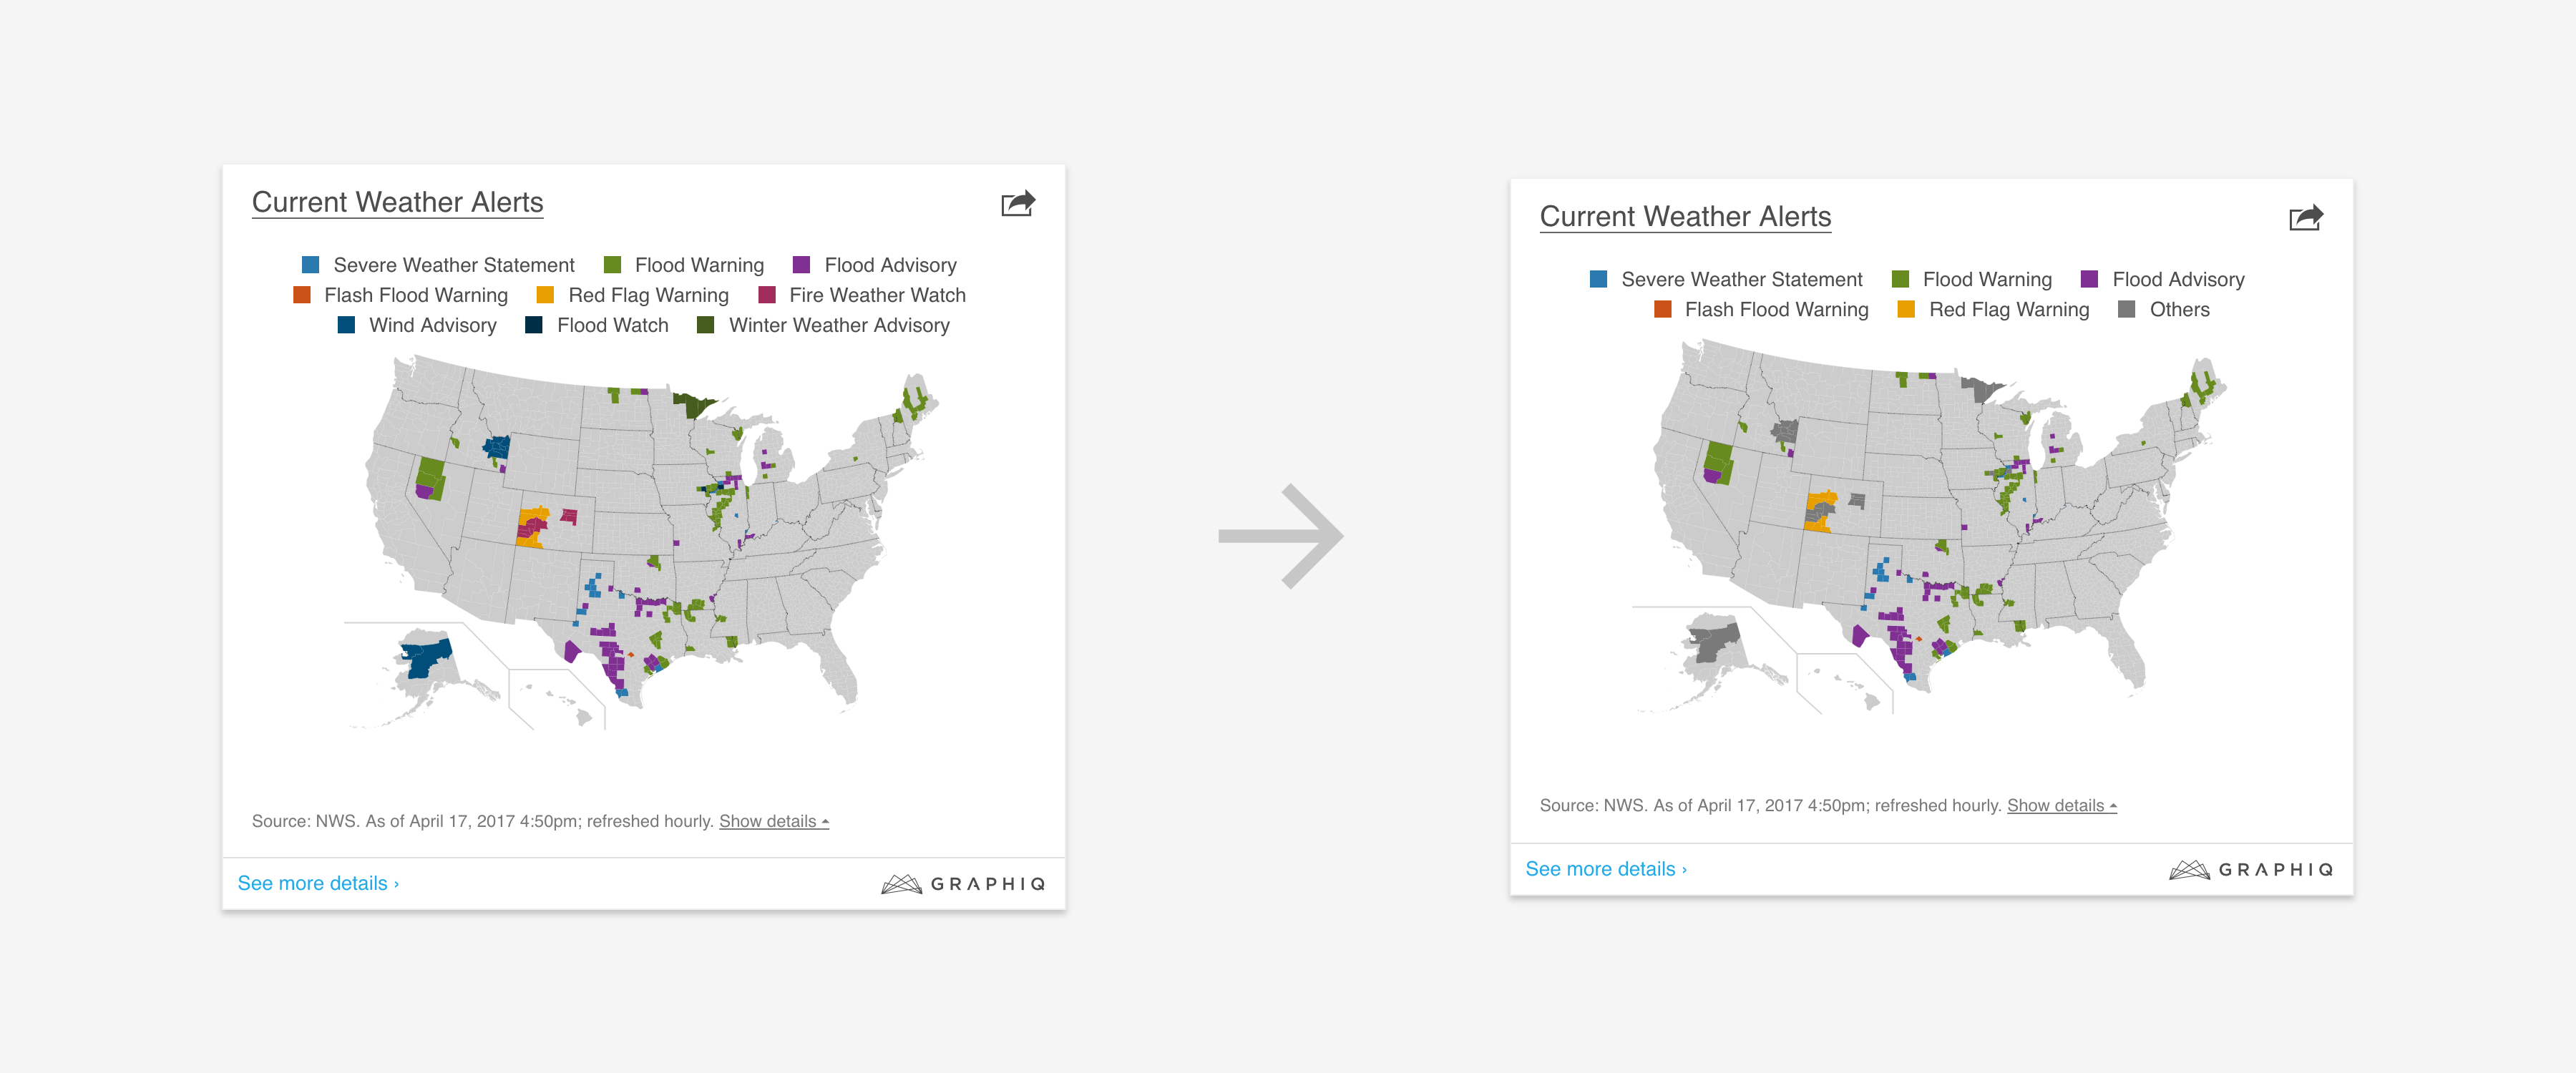
2. Too Many Data Series: Automatically group them into “others”.
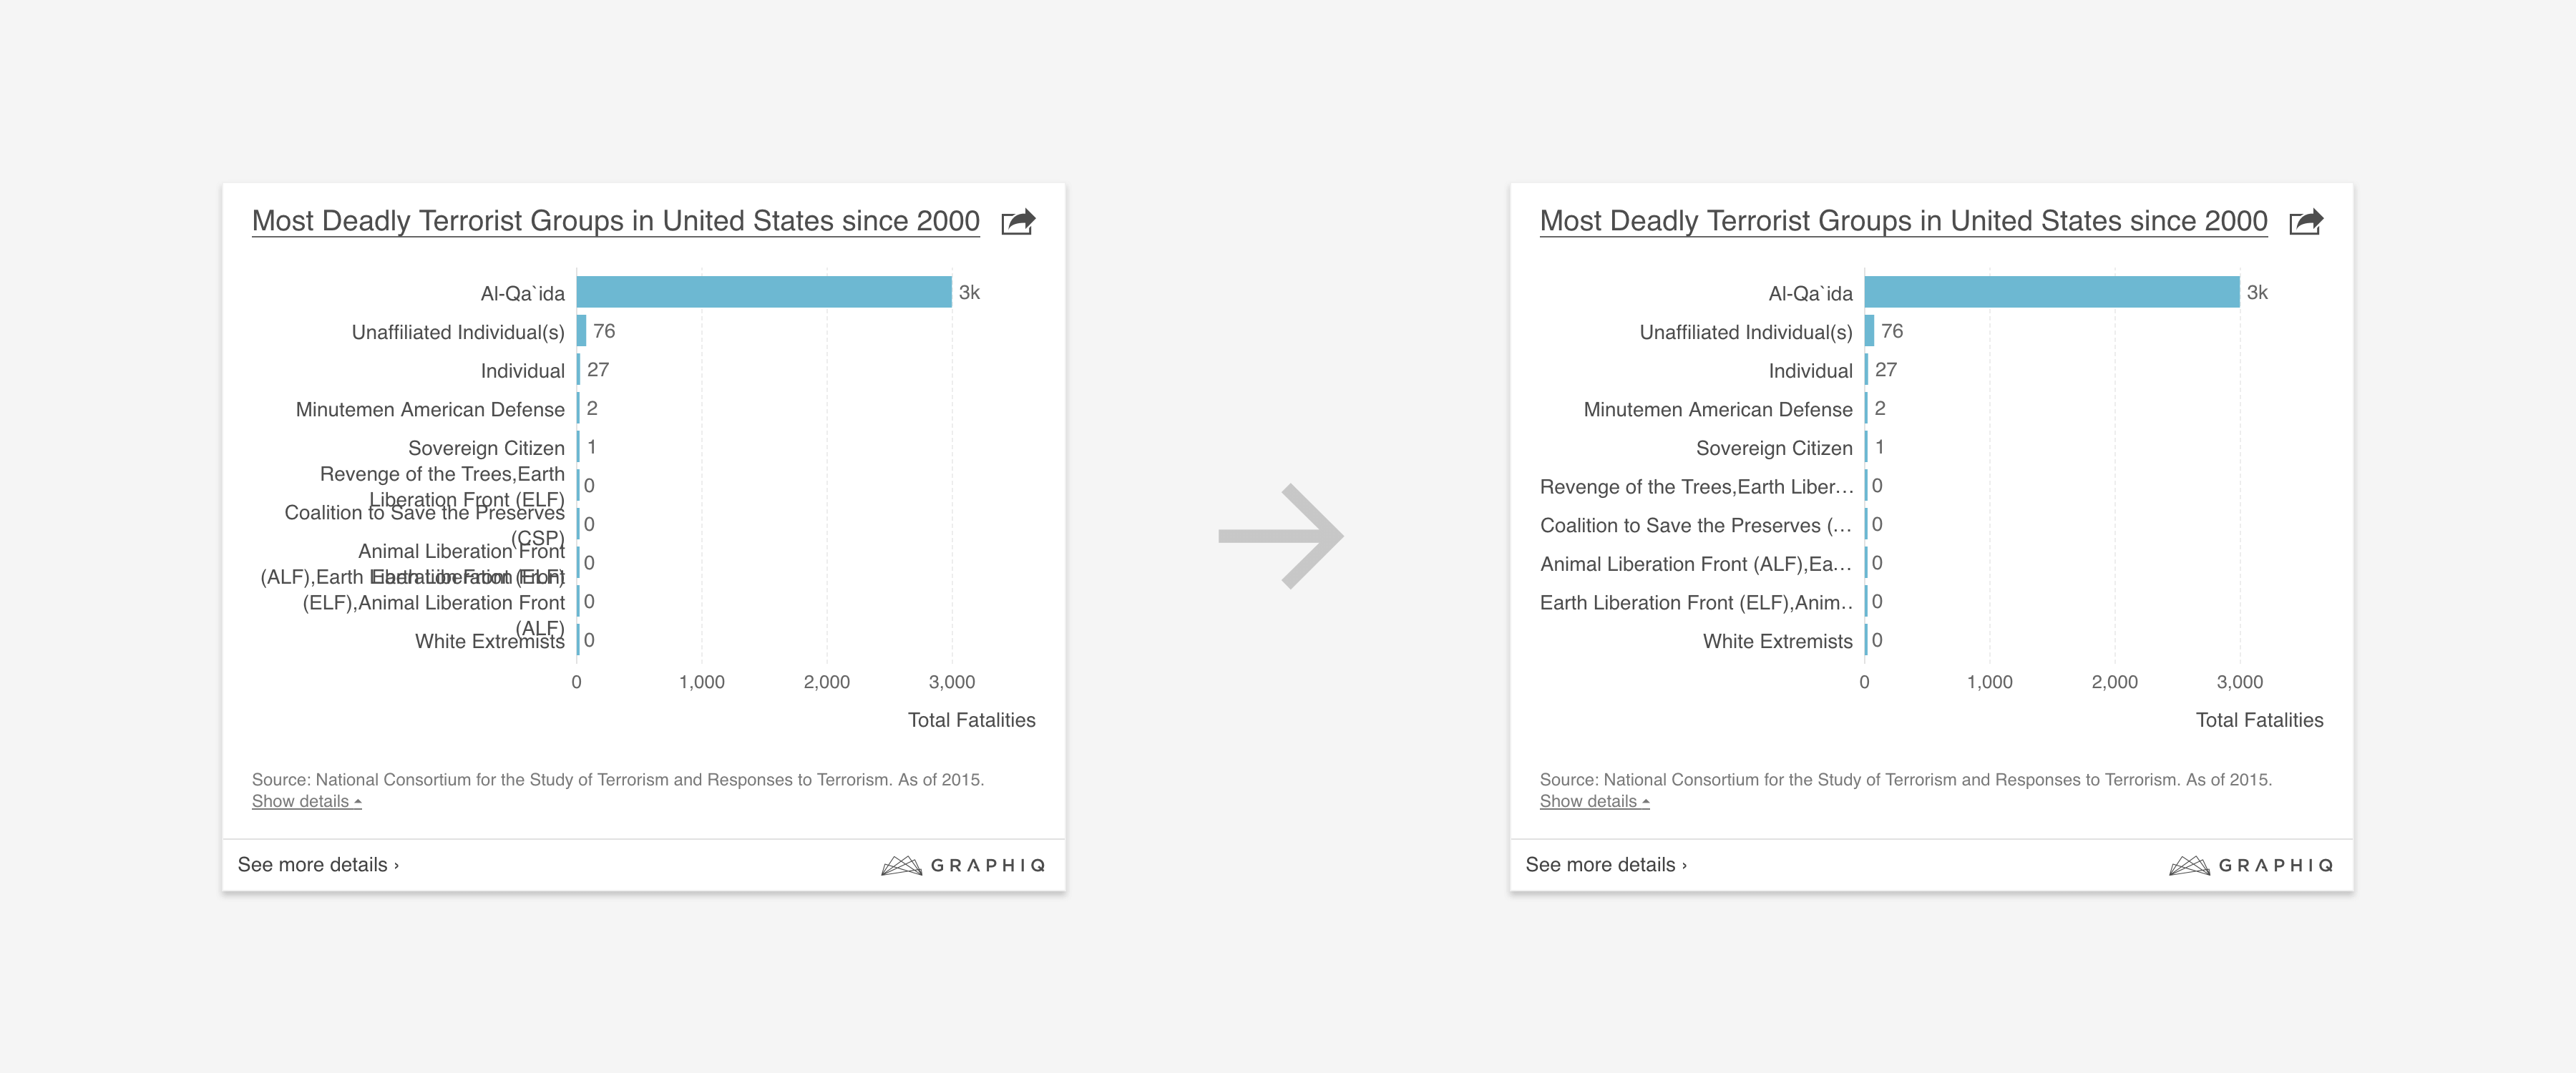
3. Verbose Labels: Cut down text and add ellipsis.
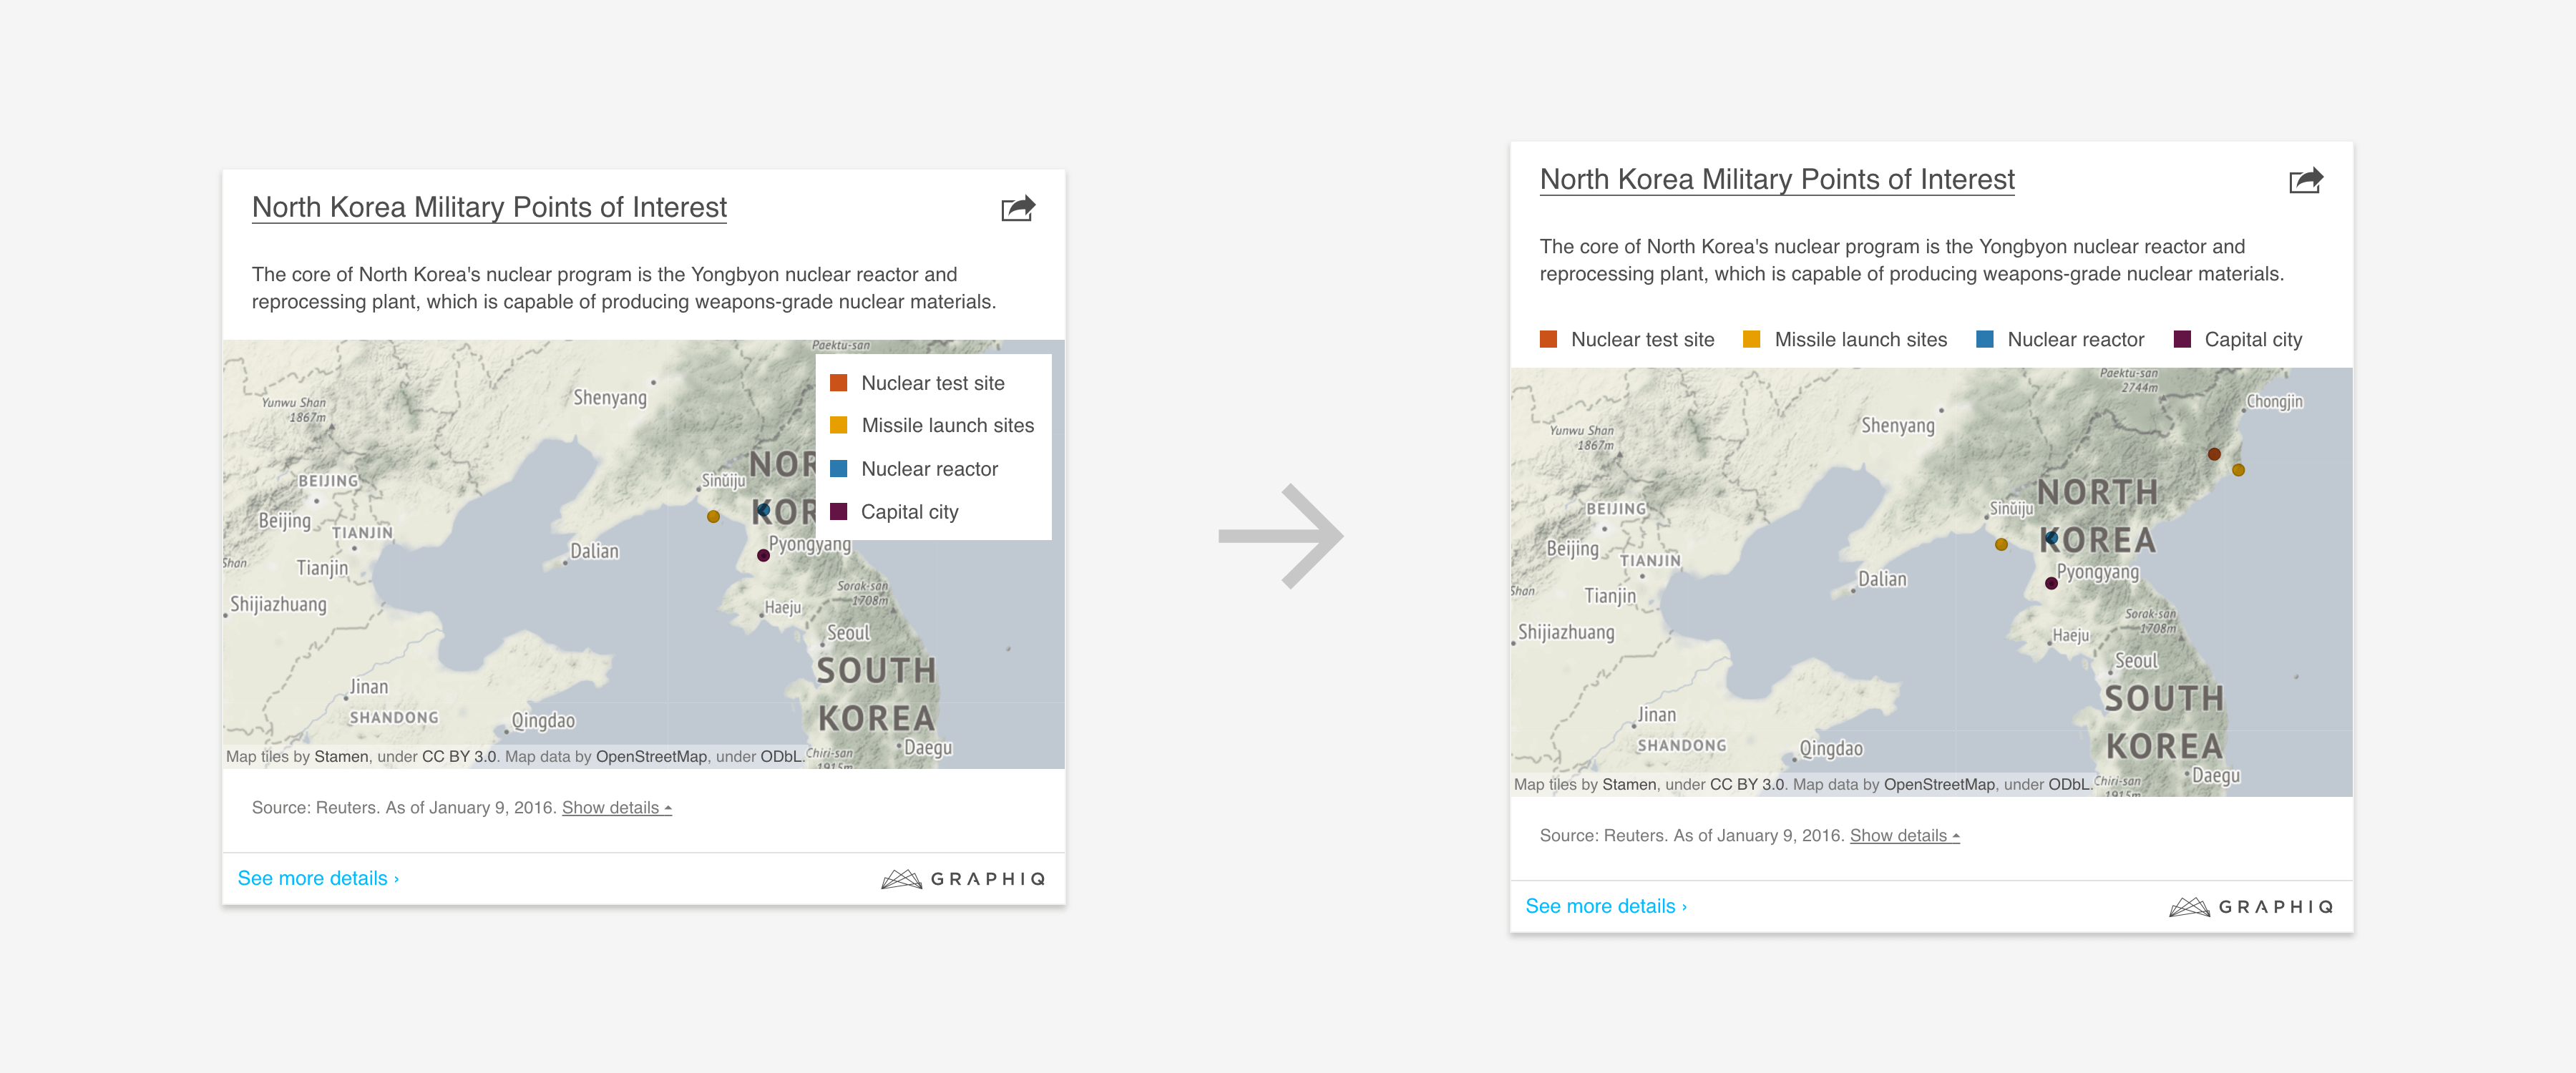
4. Elements Overlap: Avoid putting elements in places that could cover important information.
Instead of shipping a design system that assumes perfect data and requires you to continually fix data issues, we can make our system more flexible by adding graceful fallbacks for those edge cases. The design of those don’t have to be as perfect as the more popular ones, but the system should not break down in such scenarios.
D. Allow Human Overrides
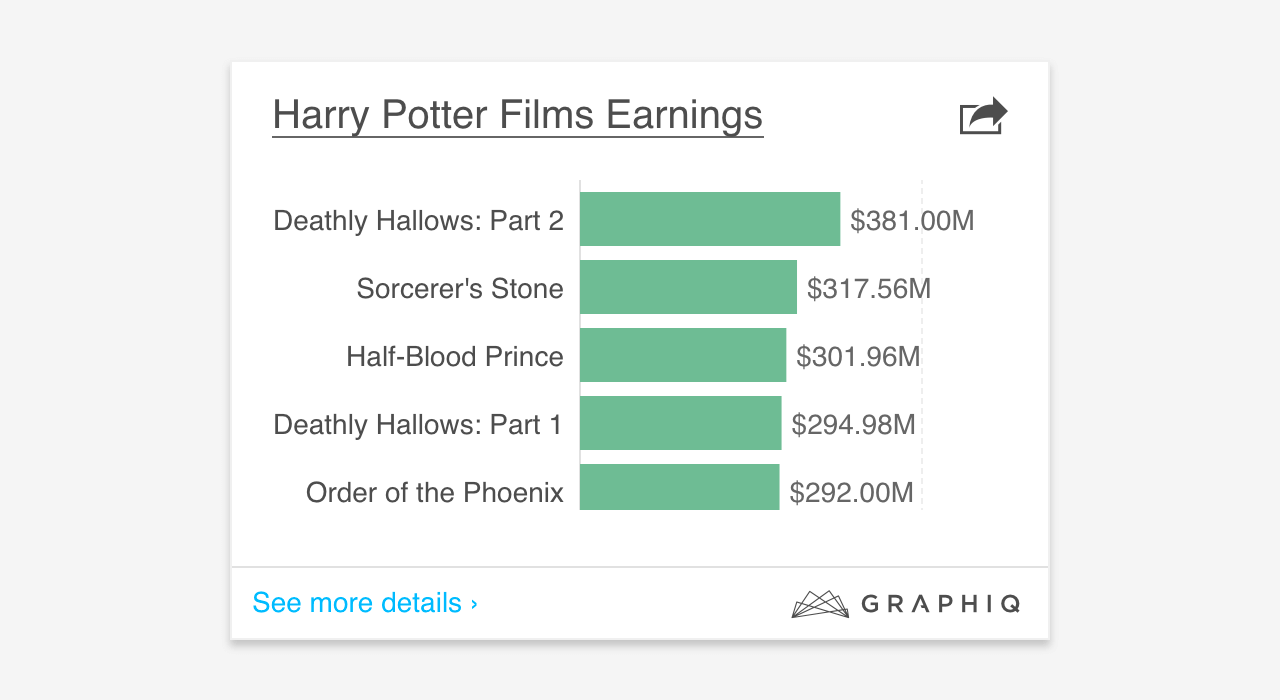
Lastly, there are outliers — the very rare cases that are both hard to foresee and expensive to target at a system level, like this one:
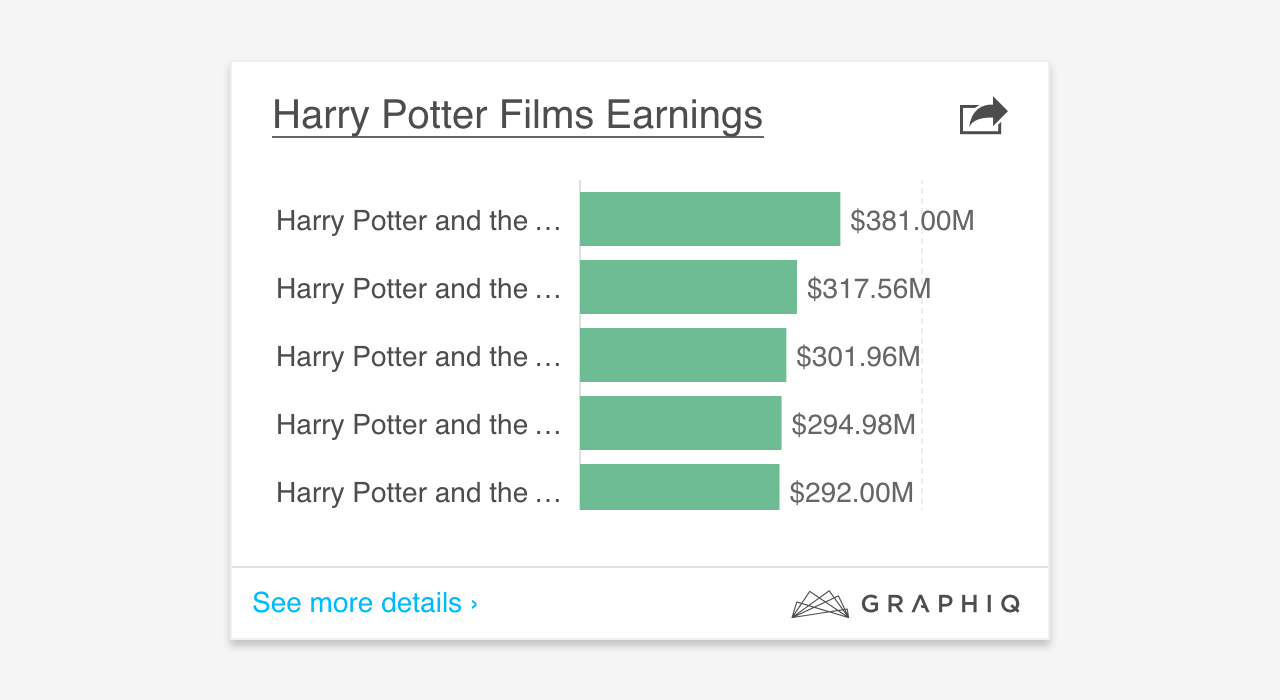
Our logic of handling long labels broke here because all the Harry Potter book and movie titles start with “Harry Potter and the…”
To make the system more robust and avoid running around and adding new features, it’s a good idea to allow human overrides for those outliers first:
It could be risky in the sense that not all people making such overrides are designers. But imagine a system that generates thousands of visualizations per day created by 50 different people, allowing overrides is a good way to allow the business grow as fast as possible.
These are the lessons we’ve learned so far, and we’re looking forward to hearing from you about your thoughts and experiences on this subject. If you have anything to share, definitely reach out to me at @moyicat.
I hope you find this article useful. If you want to get an email every time I write something new, subscribe to the list below.